
Interpreting Graphs
Information may also be gained from the graph of an equation as shown in the following examples:
Example 4. Use the graph shown below to answer the questions.
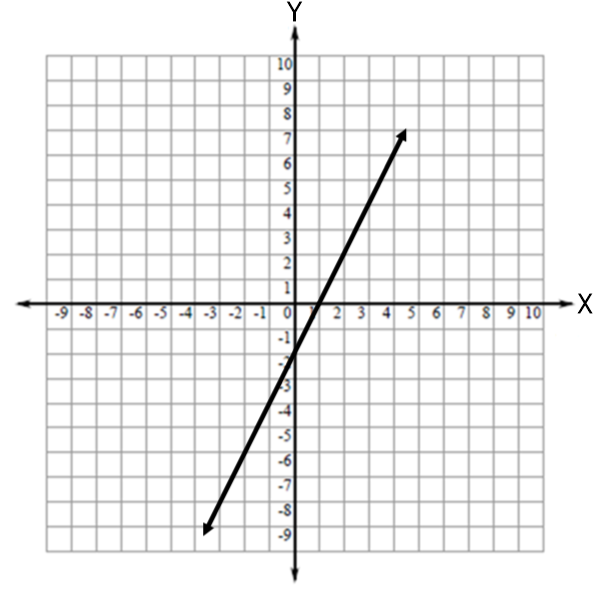
a) Find the value of y when x = 4.
b) Find the value of x when y = 4.
c) Find the slope of the line.
d) Find the y-intercept for the line.
e) Find the x-intercept for the line.
Answers:
a) y = 6
b) x = 3
c) 2
d) (0,-2)
e) (1,0)
Example 5. Using the graph given in the previous example, assume that x represents the number of years that a company has been in business, and that y represents the total profit of the company for that year measured in hundreds of thousands of dollars.
Answer the following questions.
a) What portion of the graph would need to be deleted to make it realistically describe the situation described above?
b) What would be the amount of profit for the company the third year it was in business?
c) By what amount is profit increasing each year?
Answers:
a) Anything in second or third quadrant
b) 4 hundred thousand dollars
c) 2 hundred thousand dollars
Example 6. Use the graph below to answer the questions which follow.
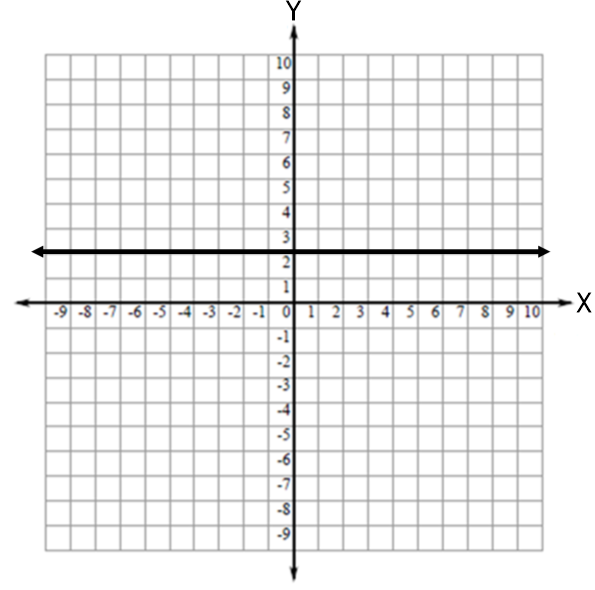
a) Find y when x = 5.
b) Find the amount y changes when x increases by 3.
c) Find the x-intercept for the line.
d) Find the y-intercept for the line.
Answers:
a) y = 2
b) none
c) none
d) (0,2)