Stellar Photometry
Introduction
A fancy title, but it just means measuring the light from a star. Measurement will generally aim to find out how bright the star is overall and also how bright it is at a number of different wavelengths, as this can give important information on the age and composition of the star. Simply by looking at them by eye, it is not readily apparent that stars actually have colours, but they really do: a pair of binoculars will show this very well.
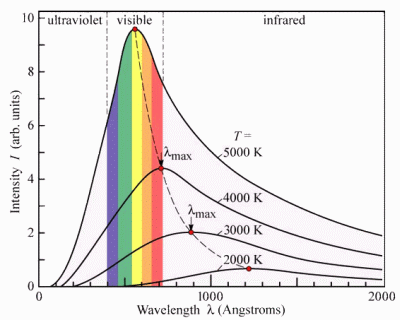
But why do stars have different colours at all? Well, physics tells us that the colour of a self-radiant object is directly related to its temperature. A cool object will glow dull red. As it heats up not only will it emit more light overall, thus causing it to shine more brightly, but the wavelength at which most light is emitted will shift towards the blue end of the spectrum, causing its colour to change. This can be seen from the diagram below.
 | At a temperature of 2000K (that's Kelvins - the scale in which scientists measure temperature, where 00C = 273K) an object barely glows, as only a minute amount of the emitted light is in the visible spectrum: almost all of it is infrared. As the object is heated, the light output becomes greater and moves closer to the visible range, so at 3000K it would be noticeably red, at 4000K it would be bright orange and by the time 5000K is reached it would be near to "white-hot" - observe that although most light is emitted in the yellow there is now considerable energy across the entire visible spectrum, resulting in an almost-white appearance.
This can be better seen by actually varying the temperature and seeing the result. There is an excellent interactive diagram produced by the University of Colorado which allows you to do just that. It has a slider which you can set to a given temperature and observe the spectrum of the light which would be emitted. This is also given in terms of the amount of Blue, Green and Red light and as an overall colour. Click here to run it: the diagram will open in a separate window/tab so you can easily come back to this page. |
Because the colour of a radiant body is so closely related to its temperature, the colour can actually be used as a direct measure of the temperature: many furnace pyrometers work on this principle. Not unreasonably, temperature deduced from colour is called the "colour temperature". It also works the other way round: a temperature implies a certain brightness and colour balance. For example, monitor screens are almost always set up in terms of a temperature. The standard setting is 6500K, with common options being 5000K (slightly red) and 9300K (rather blue). Other light sources can also be defined by their colour temperature, so a household light bulb would be about 2500 to 3000K, a flash-bulb would be about 4500K, normal daylight is around 6500K [hence the default setting for monitors], fluorescent tubes can go up to 7500K and overcast daylight (i.e. without the influence of direct sunlight) can be up to 10,000K, reflecting its blue colour. This explains why a photograph taken under normal indoor lighting on film balanced for outdoors (or on a digital camera set to an outdoor colour balance) will turn out distinctly yellow: the colour temperature of the bulbs lighting the scene is much lower (i.e. has more red in it) than conditions outdoors. Conversely, a picture taken under fluorescent light will have a blue-green cast, as the colour temperature is now too high.
The relevance of all this to stars is that their colour, and thus temperature, tells us a lot about the developmental route they will take. Stars which acquire a very dense core when they are formed from protostellar gas clouds heat up quickly and become hot blue stars. These have very short lives (by astronomical standards!), burning all their nuclear fuel in about 100 million years. They then slowly expand to become blue giants and then cool to become red supergiants. Supergiants eventually explode in a supernova, leaving behind either a neutron star or a black hole (depending on the star's original mass). Stars which form from less dense material heat up both less quickly and to a lesser extent, becoming so-called "yellow" stars. These can actually range from yellow-white through orange to red and have a relatively long life (10,000 million years). When they run out of fuel they simply start to cool and expand, turning into larger but more luminous red giants. This expansion eventually sheds the star's outer layers, forming a planetary nebula, to leave behind a white dwarf. These then cool further to form red dwarves and finally black dwarves: the stellar equivalent of cinders!
Photometric systems
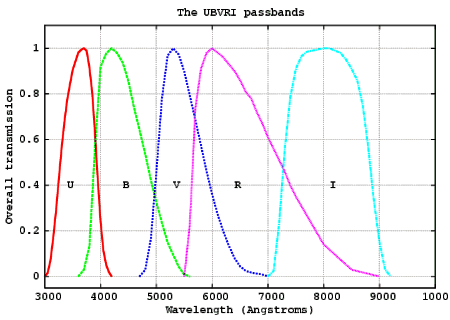
| To determine a star's colour one must assess its brightness at different wavelengths, by shining its light through filters which, in the most commonly used system, are called U,B,V,R & I (for Ultra-violet, Blue, "Visual", Red and Infra-red). Each filter has a limited range of colours it will transmit but, because practical filters cannot be made with a perfectly sharp cut-off, the ranges of adjacent filters overlap somewhat. In a system designed purely to analyse for colour, the filters would have their pass-bands equally spaced across the spectrum and the overlap between them would be the same for each filter pair. |
 | In fact, as can be seen from the diagram on the left, the pass-band for V sits much closer to that for R than to B and so overlaps it more. Thus, although the centre of the pass-band for V sits in the green part of the spectrum, in addition to green it passes more red light than blue: this makes its "effective" colour rather yellowish. This is not a mistake in the way the filters are specified however: it is done so the V filter approximates the response of the human eye, which is most sensitive in the green, less so in red and considerably less so in blue. The V filter thus shows the star as it would be seen by the eye, hence its name - "Visual" (rather than "Green"). Incidentally, this difference in the eye's colour sensitivity is also reflected in the way graphics programs reduce colours to grey-scale, using a formula like (0.28 x R) + (0.62 x G) + (0.10 x B): this is the one that best matches the grey-scale conversion which PaintShop Pro gave to the RGB values of my observations, but there are many other variants. |
AAVSO light curve
I mentioned on the main page that there is no green component data shown on the AAVSO light curve, and the above description of the UBVRI passbands explains why. Although V is essentially a "green" measurement, it is deliberately defined as a yellowish green (in order to be used as a visual reference) rather than what one might call a "spectrally-pure" green. It is thus rather different from R & B and so I have omitted it from the AAVSO plot as it cannot be directly compared to the green values taken from my pixel RGB data.

