| Novas: Picture Gallery | |
|
"Nova" is the name given to a star which suddenly and unexpectedly brightens, often by many magnitudes, and then quite rapidly fades again. The word nova means "new" in Latin, and was used by early astronomers because, as they could not see the star before it brightened, they though that novae were new stars being formed. Novas are not that uncommon (about 6-10 are discovered every year) but very few reach naked-eye brightness - only about 6 per 25yrs. The brightest nova of modern times was in 1918, when nova V603 Aquilae reached magnitude -1.4 (as bright as Sirius, the brightest star in the sky), but that was exceptional.
Stars which have nova outbursts are actually binary systems, where a small, dense, white dwarf is orbiting a larger, cooler & more diffuse companion. Importantly, a white dwarf is a star which has exhausted its original stock of hydrogen "fuel" and is now shining by utilising nuclear reactions involving carbon, oxygen & nitrogen, whereas the larger star (often a red giant) is still composed mainly of hydrogen. |
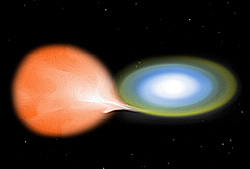 | If the two are close enough, material can be pulled by gravitational attraction from the larger star towards the smaller, as shown by this diagram. Because of the relative orbital motion between the two stars, and the fact that both will also be spinning on their axis, the material does not fall directly onto the surface of the smaller star but rather forms a disc around it called an accretion disc - click or tap on the diagram to see the components of the system labelled. |
| The strong gravitational field of the white dwarf compacts the innermost part of the disc, thus heating it (illustrated by the accretion disc turning from yellow to white in the diagram), and draws it towards its surface. What happens next varies according to the relative sizes of the two stars, their distance apart and their cosmic age. Astronomers distinguish four different outcomes; the "classical" nova, the dwarf nova, the recurrent nova and the supernova. |
Classical Nova In the case of the most commonly observed type of nova, when a critical mass of material has accumulated on the surface of the white dwarf the hydrogen cycle can restart. This results in an intense but temporary nuclear fusion explosion, which is what causes the sudden brightening. The explosion also ejects a rapidly-expanding shell of material into space which can sometimes eventually be seen from Earth, as in this image of Nova Cygni 1992 taken by the Hubble Space Telescope. Very little of the star's mass is involved in the explosion or ejected in the shell though, and so neither of the stars in the system is destroyed. It is therefore possible for another nova outburst to happen when enough hydrogen has accumulated on the surface of the white dwarf again. The timescale between outbursts for classical novae is estimated to be of the order of thousands of years though because the extremely low density of stellar hydrogen means that a considerable time is needed for sufficent of it to be transferred from one star to the other and then to be heated to a high enough temperature. | 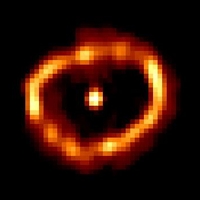 |
Dwarf Nova While a restart of hydrogen fusion is the most common cause of a nova outburst, there is another nova-producing mechanism - the generation of an instability of some sort in the accretion disc, resulting in a sudden increase in the accretion rate. The extra light given off by the rapid heating of the additional material then causes the star to increase in brightness, but by a very much lesser extent than for a classical nova and for a shorter time. The process then repeats, often quite quickly, as a sort of oscillation in the density of the accretion disc - typical timescales range from around 10 to 1000 days. This is what is called a dwarf nova. |
Recurrent Nova This is not quite the end of the story though as there is a class of nova intermediate between classical and dwarf - the recurrent nova. These are intermediate in brightness between classical and dwarf novae, with a periodicity of the order of tens of years. They are very unusual though, there being only 7 confirmed members of this class. This is probably because the conditions which determine whether a binary system will produce either a classical or a dwarf nova are finely balanced and so most systems will tend to fall into one camp or the other. Indeed, it is thought there are recurrent novas of both basic types - produced by either a "small" nuclear outburst or a large instability effect. It is the relatively large surge in brightness and the relatively short (but often rather irregular) interval between outbursts that make recurrent novae of particular interest to astronomers though. |
Supernova A supernova explosion is far more intense than the other types and results in the destruction of the star involved. A nova-type outburst which gets so hot that a runaway nuclear reaction is triggered, disrupting the star, is one way a supernova can be triggered (a so-called Type Ia event), the other being when a red giant star at the end of its life undergoes sudden collapse because the outward pressure exerted by its failing fusion reactions can no longer sustain the core against its own gravity. Depending on the mass of the star, the collapse will either cause the outer layers to be violently expelled in a supernova explosion (a Type IIa event) or will result in the star becoming a super-dense neutron star or black hole. The remnant of a supernova is somewhat similar to the result of a classical nova, a shell of rapidly expanding material, but in the case of a supernova the shell consists of the entire mass of the original star. The remnant of a Type Ia (nova-style) supernova shown on the right is known as Kepler's Star, which appeared in 1604. | 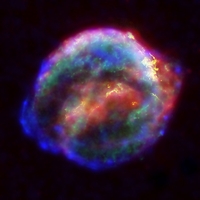 |
Note that a nova is entirely different from a variable star, which brightens and dims predictably over and over again but usually only by a small amount. There can be a structural similarity though, as some variable stars are actually composed of two mutually-orbiting stars which periodically eclipse each other as seen from the Earth. The components can be any type of star though, not necessarily the white dwarf / red giant pairing of a nova star, and the components are sufficiently far apart that no material is exchanged between them, meaning that a nova cannot be triggered even if the pairing is appropriate for a nova star. |

Nova Delphini 2013 | |
This nova was discovered by a Japanese astronomer on 14th August 2013. It was initially at mag. 6.8 but rapidly brightened to around mag. 4.3 before beginning its slow decline. Observing conditions here were very poor during this period, with cloudy skies at night, but I was able to glimpse some stars on 20th August despite high cloud and a full Moon. I thus took a series of images, most of which showed the nova but were not clear enough to be usable. Just a handful were surprisingly sharp though, so I was very pleased with the overall outcome. I was unable to see the nova either visually or through binoculars that evening, mainly due to the illumination of thin clouds by the Moon which has caused the image below to have a somewhat mottled background.
|
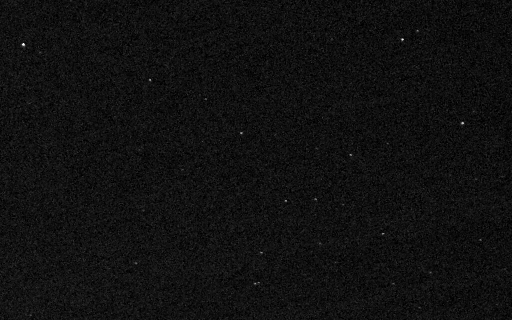 | Here we have an image I took just after midnight on 20th/21st August, showing a distinctive group of stars close to the head of the dolphin representing the constellation Delphinus. The nova is the bright star to mid-right. That is it a nova can be seen by clicking or tapping on the image, to convert it to a star-map of the area generated by a planetarium program: the nova is seen to disappear i.e. there is normally no star of that brighness at that location. Clicking/tapping again will restore my image. |
It is clear that the nova is somewhat brighter than the star above and to its left (mag 5.65) but rather less bright than the one at far top left (mag. 4.78). By plotting the brightness of many of the stars shown on the central part of the original [larger] image against their known magnitudes I was able to estimate that the nova was magnitude 5.36. This is exactly consistent with the value of mag. 5.35 given by the light-curve generated by the American Association of Variable Star Observers (AAVSO).
| The skies were uniformly cloudy for all of the next week, so by the time I next saw the nova its brightness had fallen considerably. I estimated it at mag. 6.29 at midnight on 27/28th August, again exactly in agreement with the AAVSO chart. After one more cloudy evening I was then able to observe on three consecutive nights. That of 29th/30th August was particularly clear, so I got a very good view with binoculars though not naked eye. The images taken on these nights showed that the nova was now distinctly reddish: this was not my imagination, for the AAVSO curve showed this also. |  |
By the end of August the visual magnitude had decreased to almost 6.7, with the red component remaining strong. The nova continued to dim as we moved into September, falling below mag. 7 on the 2nd. It was down to 7.3 on the 5th and slightly fainter on the 7th. We then ran into another week of cloudy & rainy weather so I wasn't able to make another observation until 14th September, when it had dimmed to mag. 7.6. It remained about the same until at least the 18th (a "plateau" confirmed by the AAVSO light-curve) but had headed towards mag. 8 by the time I was next able to observe on the 22nd, getting down to 8.3 by the 26th. This made it increasingly difficult to derive accurate estimates for its brightness, as it was approaching the limit of visibility on the images (where the pixels representing the nova start to become difficult to distinguish from the random "background noise"). I thus stopped taking pictures at this point.
| Click or tap on the image above to view an animation showing the situation on 20th, 27th & 29th August and 2nd, 5th, 14th, 22nd & 26th September. The dimming of the nova is quite dramatic. |
I continued to keep an eye on things by regularly checking the light-curve, which showed that the nova dimmed very rapidly towards the end of the month, with the red component decreasing fastest of all (as hinted at by my graphs). It was below mag. 9 by October 3rd, making it effectively unobservable from this point onwards.
Colour changes
 | I noted above that as the nova dimmed it acquired a definite reddish hue. To demonstrate this I constructed some "colour squares", each of which was the colour of the nova's brightest pixel in the images taken on the first six of the days mentioned above, the images having been adjusted to ensure that the overall brighness was the same for each. I also made grey-scale versions of the squares to show the nova's brightness levels. The result is shown on the left: it is, I hope, clear that as the nova dimmed it became increasingly red.
|
The reddening effect is supported by graphs of both the absolute values of the red, green and blue components of the nova's colour and also of the relative amounts of each of them as compared to the nova's overall brightness.
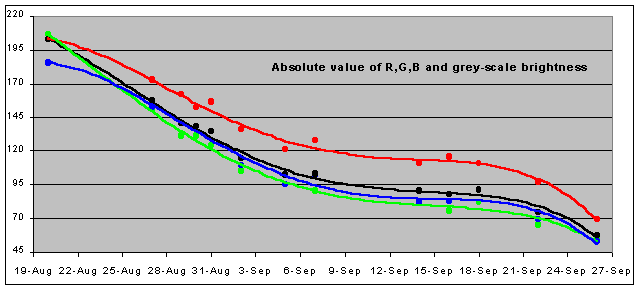 | We see here that although all three components, and the visual magnitude (in black), decrease with time as the nova becomes less bright, the red component is consistently greater than both green & blue. |
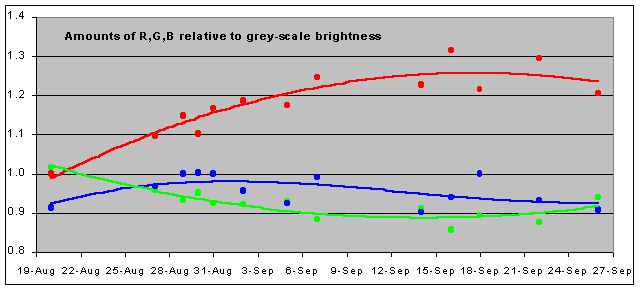 | The red component in fact becomes increasingly dominant as compared to the other two, which constitute a slowly decreasing fraction of the overall brightness. |
The fact that the nova became increasingly red is not particularly surprising. As I explained at the top of the page, a star turns into a nova because the quantity of material accreted from a companion star has reached a critical mass, which causes the material to suddenly undergo nuclear fusion. The vast amount of energy thus released in a very short time causes the star to (quite literally) glow white-hot, accounting for its enormous increase in brightness (over 100,000 times in the case of Nova Delphini 2013). However, because the amount of material is insufficient to produce a run-away reaction the energy release soon ceases. The star thus starts to cool down again, and the more things cool the redder they become: this is true for stars just as much as it is for toasters and 3-bar electric fires (if you can remember such things!).
I've detailed on an extra page how I analysed my images of the nova to determine its magnitude and colour. Click here to read it.
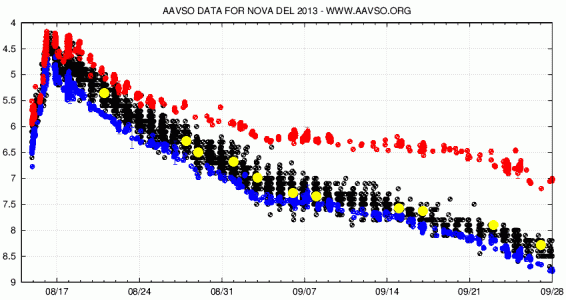
And finally! Here is the AAVSO light-curve to which I have frequently referred. The black dots are the visual magnitude estimates of the various observers from around the world and the red & blue ones are the nova's red and blue colour components respectively. There is no green component data due to the way the colours of stars are assessed. The full story can be read on an extra page by clicking here, but basically although there is a "green" measurement it is rather different from R & B and so cannot be directly compared with my G values: I have thus omitted it from the plot. I've added my own magnitude estimates in yellow. As can be seen, in each case my values sit very nicely within the range of the visual observations. Note that from about 25th August the R-magnitude values are much higher than the visual ones, in confirmation of my observations noted above.
All in all, I felt that the observations of my first nova had been highly successful, achieving a very accurate result using really quite simple methods. Roll on the next one!

Nova Cassiopeia 2021 | |
| Well, the next one did eventually turn up but not for some while! This nova, also known as V1405, was again discovered by a Japanese astronomer, on 18th March 2021. It was initially at mag. 9.6 but rapidly brightened to around mag. 7.7, declined to around 8.1 and then slowly brightened again to reach mag. 7.0 by the beginning of May. It then rapidly brightened to mag. 5.3 in just one week (see light curve, below), where it remained until mid-May before dropping back to mag. 7.5 and then slowly brightening again. This made it a very bright and therefore unusual nova which I felt should be possible to capture without too much difficulty. |
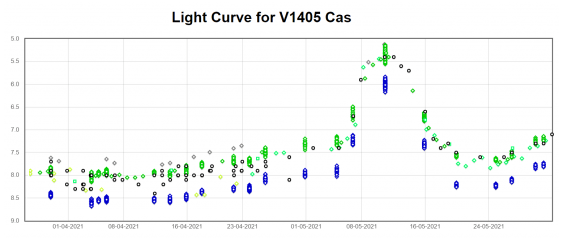
As with Nova Delphini, observing conditions here were very poor during this period, with cloudy
skies and frequent rain-showers, but the skies finally cleared on 19th May, enabling me to take some images - but just after it had dropped back from its maximum brightness, of course!
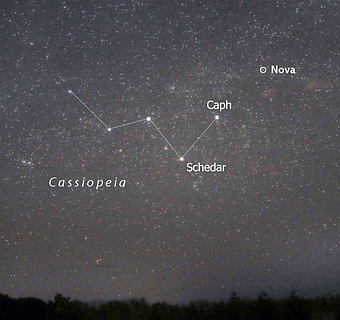 | This image, taken from the Sky & Telescope website, shows the location of the nova relative to the well-known northern-sky constellation of Cassiopeia after which it is named. A straight line running through the two stars identified in the image, Schedar (or Alpha Cassiopeiae) and Caph (or Beta Cassiopeiae) arrives almost exactly at the nova, making them excellent pointers to the area of interest.
The first image below is my initial locating image, based on the Sky & Telescope image and taken at wide angle to make sure I was pointing my camera in at least the approximately correct direction! |
| The bright star in the trees at bottom left is Schedar and the one about 45 degrees up & right of Schedar is Caph. As shown above, a straight line running from Schedar through Caph for about the same distance again arrives almost exactly at the nova. Click or tap the image to show labels identifying the pointer stars, and take note of the chain of stars at top right. (Note: don't try to scroll the view by swiping on the image as this does not work on all touchscreens. Use the text area instead) | 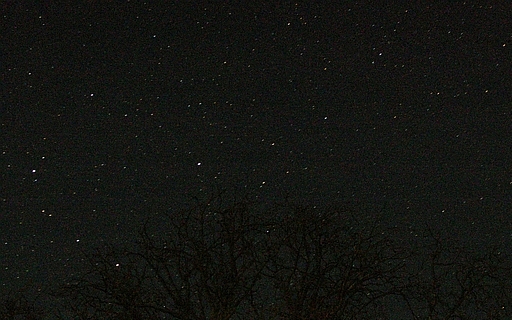 |
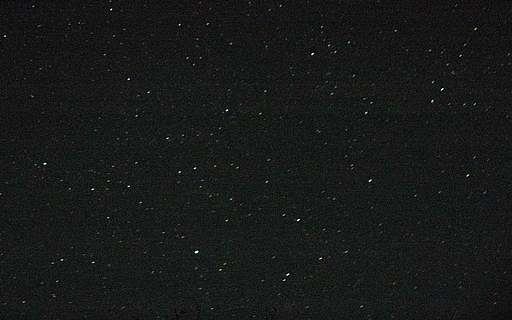 | I've now zoomed in to some extent, so Caph is near the bottom of the frame, to left of centre, and the chain of stars is in the top-right corner. Now look at the downwards-curving arc of stars to the left of the chain, with the brighter star on its left. Just below it you can see a slight "smudge": this is in fact the nebula M52. The nova is the star at the right of the group of four below M52. Click or tap the image to show labels identifying these various objects. |
Quite a jump this time, as I was confident I was looking in the right direction! The bright yellow star to top left is the one to the left of the downwards arc noted above, and the triangle of stars to the right (with the other bright yellow star) can also be clearly seen above. Exactly between these two is a pinkish star - this is the nova I was trying to find! M52 is again just visible above and to its left.
All the stars are showing as streaks rather than dots due to the long exposure I used. I couldn't be sure I would have another chance to see the nova so felt I should, if anything, overdo the exposure to ensure I captured something. This one is about 16 secs at 800ASA: "about" because I actually used the bulb setting, which holds the shutter open until the camera decides enough is enough. | 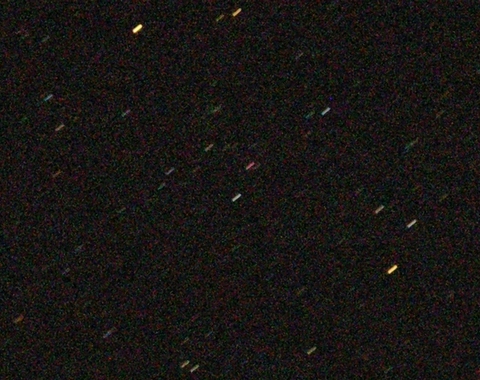 |
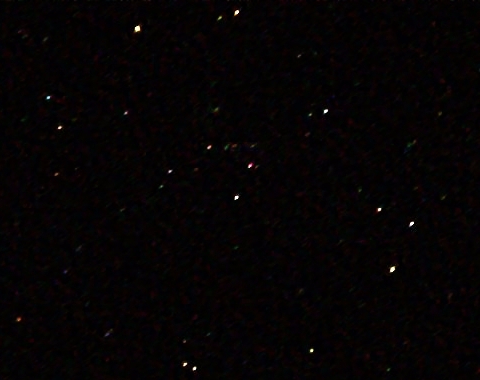 | With a bit of image-processing trickery courtesy of the SmartDeblur program (v.1.27) the stars can be "unstreaked" to show a more usual type of image. This process can sometimes lose much of the colour, but the nova is still seen as rather pink.
But how can I be sure this is actually the nova? By comparing it with a star chart, that's how. If you click or tap on the image it will be replaced by a chart produced by the program C2A. Click/tap again to restore the image. It should be very clear that the chart has no star where the nova has suddenly appeared - there is a faint one corresponding to the star just to its right, but none in exactly the same position as the nova. There is a star there of course (the nova cannot suddenly appear from nothing) but before the outburst it was very dim and is therefore not shown on the chart. |
And the final zoom gives us a "close-up". We see here the triangle with the yellow star and the group of stars including the nova: M52 just sneaks in at the very top. The pink colour of the nova is now very apparent.
The same trick can be employed to get rid of the streaks: click or tap on the image to transform it. The distinctive colour of the nova has been retained very nicely this time. | 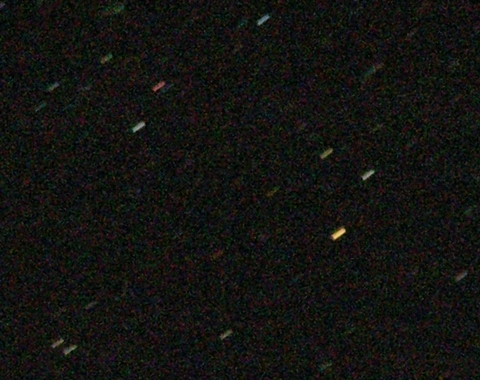 |
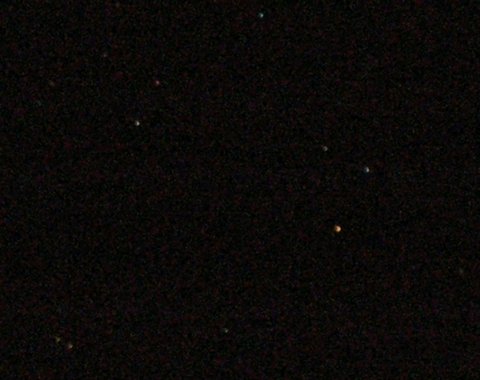 | And just for some reassurance that the pink colour is not caused by the long exposure, here's another close-up shot (accidentally!) taken with a much shorter exposure - maybe only one second or so - and not processed in any way other than being reduced in size. The colour of the yellow star is still very much in evidence, as is the pink of the nova. The general lack of stars does, however, illustrate why a longer exposure is necessary in order to capture the whole scene satisfactorily! |
The spectrum of the nova
I shall now again turn my attention to why novas tend to be reddish in colour, or to evolve towards that colour. I mentioned in connection with Nova Delphini that part of the answer is simply to do with cooling from the high temperatures produced by the violent nuclear reactions which cause the pre-nova stars to brighten. The second reason is that these high temperatures cause novae to not only "glow" but also to produce specific spectral components generated by excitation of the atoms of which they are made. These components come in various "families", or series, depending on how much additional energy the atom receives. The energy involved determines the wavelength, or colour, of the light emitted and so only some of the series generate components which fall within the visible spectrum and thus affect the perceived colour of the nova.
Because all stars are made mostly of hydrogen, the commonest additional spectral components are those produced by this element. The most important hydrogen series is the Balmer series, which has components in the visible spectrum which are red, blue-green, blue & violet. This is illustrated by this image from Wikipedia:-

The spectrum of Nova Cas 2021 has these additional spectral lines (named according to the Greek alphabet), as is clearly shown by this image taken by British Astronomical Society member Mike Harlow. Click or tap the image to overlay a size-reduced version of the spectrum above for comparison.
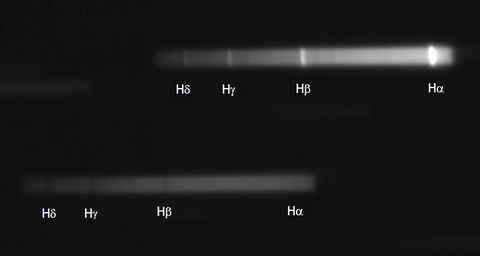
© Mike Harlow 2021
The spectrum of the nova is the one at the top. The bottom one is of a nearby star, for comparison. Note that both spectra are basically a continous band. This is the objects' "glow", due to their temperature. The star's band is composed of all wavelengths from red to violet in approximately equal amounts and so the glow is white - this is the reason why nearly all stars look white or silvery. The nova's band is much more intense at the red end however, and so it will have a reddish glow. In addition, the spectrum of the nova also has a number of brighter bands, which correspond to the Balmer series shown above. Note also that the spectrum of the star has dark bands where the nova's are bright. This is because the star does not produce enough energy to energise its hydrogen atoms, which instead simply absorb energy from the outgoing light at the same wavelengths as they would emit at if energised. The dark lines are called Fraunhofer lines, after the German physicist who discovered them in sunlight.
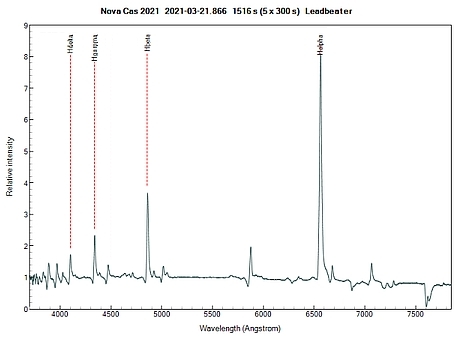
The next image, produced by British Astronomical Society member Robin Leadbeater, shows just the bright hydrogen lines in more detail. Note that, although it clearly shows the same features, the spacing of the hydrogen lines is not quite the same as in the images above. This is because those above were formed by a spectrograph using a prism, and this image by one using a diffraction grating. Spectra formed using a prism are more spread out at the violet end as compared to those formed using a diffraction grating.
© Robin Leadbeater 2021
The advantage of this spectrum is that it shows the relative intensity of the lines directly as numbers. If we use these relative values to add together the colours of each feature in the correct proportions, the result is a sort of "rose pink" colour. The hydrogen emission lines thus add to the somewhat reddish-white glow to produce the overall light pink colour of the nova that is observed in my images. I would thus claim that I have sound scientific reasons why my captures are true to life!
Further observations
Almost all the nights after 19th May until the end of the month were cloudy here, so I was very pleased I had decided to go out on that evening and that I had done what I could to ensure I was able to obtain some useful images. Conditions began to improve as June was ushered in though, so I was able to make some further observations early in that month. I captured images in the same way as I had originally, in order to make comparions easier, and was keen to see whether I had detected any changes in the nova's brightness.
I had been keeping an eye on the light-curve of the nova over this period and although it seemed it was not about to flare up again any time soon a slight but distinct brightening was indicated. I thus set out to compare my original observations with those taken on 1st & 5th June. This was not entirely straightforward as of course conditions were unlikely to have been the same on those three days and there was a technical issue to consider - as mentioned above, "bulb" exposures tended to vary in length a little. I would thus have to carefully process my images before I could come up with a consistent result. Fortunately, there was a convenient comparison star just below the nova so as long as I ensured it was the same brightness in all my final images then any change in brightness of the nova would be "real" rather than an artifact of the process.
I was very happy to find that I had indeed registered a brightening - compare the images above with this one taken on 5th June, which has been carefully calibrated to have the same colour balance and overall brightness as the earlier image:-
To save you scrolling all the way up in order to compare the images, click or tap on the image to see the view on 19th May (and again to revert). The nova is very clearly brighter on 5th June, and has lost most of its pink colour. In fact, although it is not entirely clear from the large images, if one examines the individual pixels of the nova's "streak" on the two dates there is an excess of red of 31% on the 19th but it's still at 13% on the 5th, giving the nova a slight pink tinge under high magnification.
These two squares show the change - that on the left represents 19th May and that on the right 5th June. As can be seen, even on 5th June there is still a slight red colouration.
 |  |
The reduced reddness is due to the greater degree of "glow" at the blue end of the spectrum, caused by the higher surface temperature which has produced the brightening overall. The reason for this higher temperature is almost certainly because sufficient material from its companion star had accumulated on the surface of the nova star to cause a temporary upsurge in nuclear fusion, thus releasing more energy.
And in case you are wondering, the reason for the different orientation of the images is simply the difference in time between them. The heavens rotate around the Pole Star daily because of the Earth's rotation about its axis, but this is a "sidereal day", not the "calendar day" of 24hrs we are used to which is measured relative to the Earth's orbit round the Sun. Because a sidereal day is about 4 minutes shorter than a calendar day the stars "gain a bit" every day, changing their position in the sky as time goes on. I could have corrected for this, but rotating images tends to decrease their quality which could have affected the brightness comparison so I decided not to.
To show the increase in brightness more clearly, I took small sections from images taken on 19th May, 1st June and 5th June, showing just the nova and the comparison star, converted them to greyscale (to avoid complications caused by differences in colour) and placed them together:-
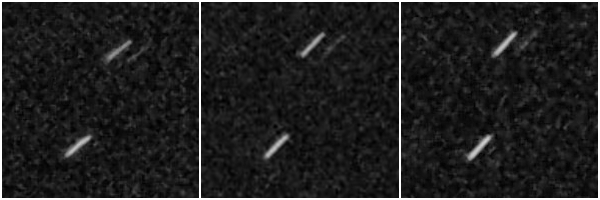
It can be seen that while the comparison star (at the bottom) stays the same brighness in all three sections of the image, the nova (at the top), brightens noticeably between the first two sections and then somewhat more in the third. This is consistent with the light curve, which shows the nova brightening somewhat throughout this period. I felt I had achieved a satisfactory result therefore.

RS Ophiuchi 2021 | |
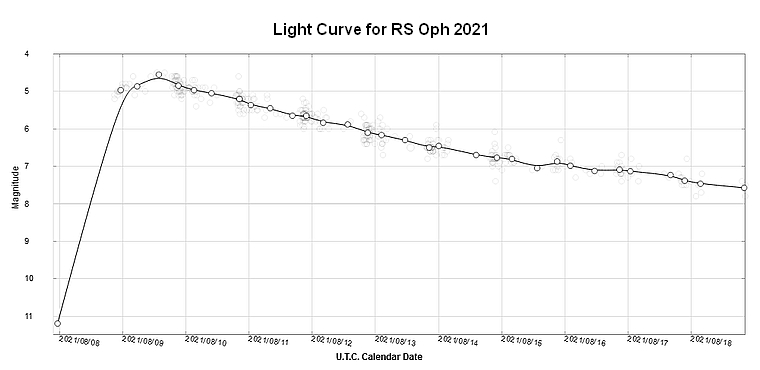
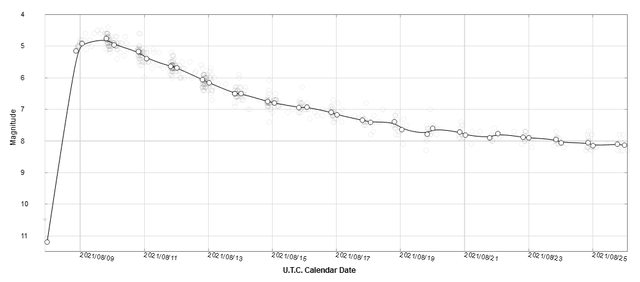
| The outburst of this nova was particularly notable because it belongs to the rare group of recurrent novae - only 10 are known within our galaxy. Its most recent outburst was in 2006, but the ones before that were in 1985, 1967, 1945 (perhaps), 1958 and 1933 so although it is clearly recurrent, its period is very variable. Further outbursts are thus keenly anticipated. This one was detected by Brazilian astronomer Alexandre Amorim on 8th August 2021, initially at mag. 5.0 having been at 11.2 the day before. It reached a peak brightness of mag. 4.5 shortly afterwards before beginning a steady and quite rapid decline over the next few days - it had fallen below mag. 7 by the 16th. |
Observing conditions here were initially poor, with cloudy skies at night, so I wasn't able to attempt any observations until 12th August. Even then, there was a considerable amount of patchy cloud close to the horizon with an unusually large amount of skyglow. I wasn't quite sure which part of the sky held my quarry though, so I set off for my usual spot in the allotments armed with a vital compass in addition to camera, tripod & torch to see what I could find.
Unlike the distinctive "W" shape of Cassiopeia, Ophiuchus (the Serpent Bearer) is not a constellation which stands out in the sky, and has no obvious asterisms, so I haven't included a location image for RS Oph as I did for the prevous nova. Given the lack of any bright stars I could use as a pointing guide, I simply pointed the camera in the direction the compass told me was the azimuth of a star close to where RS Oph should be (derived from the C2A astronomical program), set it to 28mm (wide angle) and took a couple of test shots to place the lower edge of the field-of-view just below the horizon - conveniently, the vertical FoV of the lens was about twice the altitude of my check star, so therefore in this position RS Oph must (should?) be in the middle of the frame. Once everything was aligned I took a series of "bulb" exposures (which in practice were about 20sec) at ISO800 in hopes of capturing something.
Fortunately, the bulk of the cloud began to thin and lift as the night wore on and so the sky slowly started to clear. I thus ended the session by taking a short series of exposures slightly zoomed-in to what I thought (hoped?) was the relevant area, and retired back home to see what I'd got.
| This is one of the wide-angle images, which shows the extent of the cloud and skyglow quite nicely. The clearer sky to upper centre does, however, show RS Oph. Click or tap the image to show it. (Note: don't try to scroll the view by swiping on the image as this does not work on all touchscreens. Use the text area instead) | 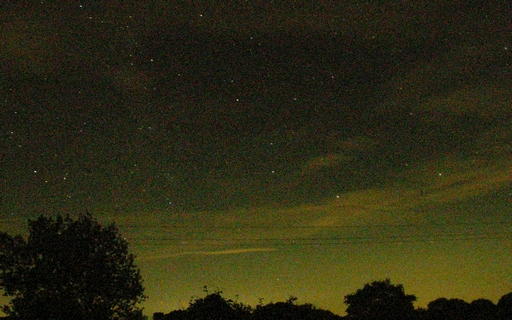 |
When I examined the wide-angle shots more closely it was clear that, although what I assumed was RS Oph was visible in a few of them, it was not sufficiently distinct to deduce much more than the fact that it was clearly present in a place where C2A did not show a star i.e. I had definitely captured the nova as I had hoped. The slightly zoomed-in shots did show more detail, though they were still not entirely sharp as a result of the remnants of the cloud banks. However, after stacking a couple of them together, adjusting the contrast levels and converting to greyscale I managed to produce an image which shows the nova and the surrounding stars quite nicely.
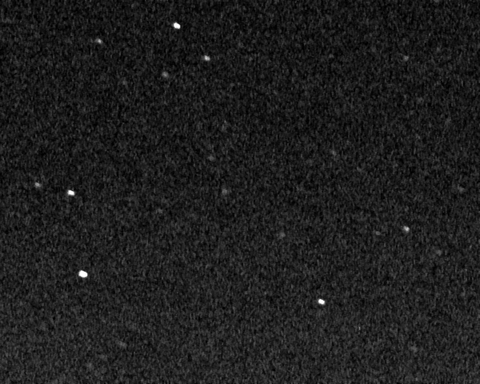 | Here we see the nova in the centre of the image, surrounded by the stars which can be seen in the wide-angle view above. The bright star at the top of the frame is not actually in the constellation of Ophiuchus at all, being Zeta Serpentis. The pair to the left are Tau (upper) and Nu (lower) Ophiuchis, with Mu Ophiuchis to bottom right.
To see that the nova "should not be there", click or tap on the image to replace it with a map of all the stars in the area down to magnitude 7, produced using C2A. It is clear that there is no star which matches the object in the centre of the captured image. A further click/tap will show the two images overlaid, which reinforces the conclusion that there is no match for the observed object. It clearly must be the nova, therefore. |
Despite the lack of sharpness in the image, it can still be used to estimate the brightness of RS Oph on that night. I think it is clear that the nova is a little brighter than the star just above it and to the left (which is magnitude 6.2) but not so bright as the lowest one in the triangle at the top (which is 6.0). RS Oph must therefore have been about magnitude 6.1 when the image was taken, which was just before midnight (BST) on the 12th. This compares very well with the official light-curve as published by the AAVSO (American Association of Variable Star Observers), as shown below. In fact, the average of the four observations recorded between 23:35 and 0:45 BST on the night of 12/13th is exactly 6.1 - quite a remarkable agreement.
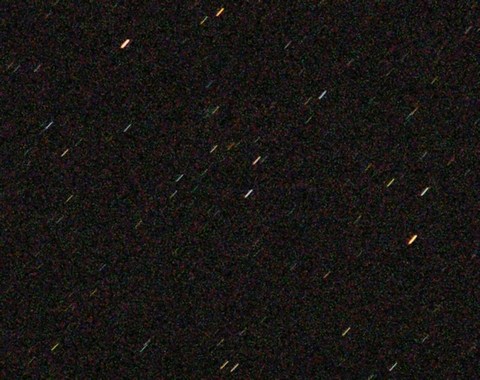
Skies were next clear on the evening of 16th August so I again made a pilgrimage up to the allotments. The sky to the south-west was free of any obvious cloud-bands but still looked slightly "milky" and I could see very few stars by eye. However, a wide-angle shot showed many stars so I was confident I could move directly to more zoomed-in shots. Indeed, I quickly found I could go right up to 200mm at ISO800 without capturing too much background noise, and although this meant the stars formed trails (because of the long exposure), these were very narrow and well-defined.
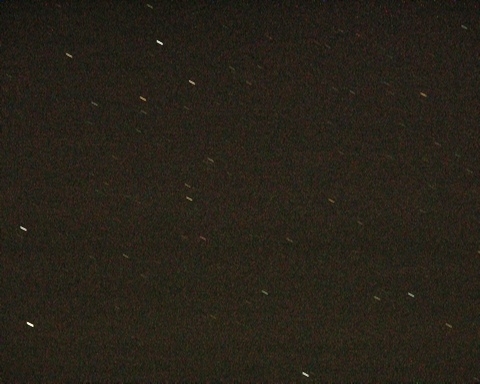 | So narrow and well-defined in fact that I've had to enhance the trails somewhat in this reduced-size image! As with Nova Cas, one can transform the view by applying the magic of SmartDeblur - click or tap on the image to remove the trails.
The image shows approximately the same view as the one from the 12th, with the nova down and left of centre. |
Particularly noticeable in this image (especially in the "no trails" version) is the intense red colour of the nova - even more so than for Nova Cas. The development of RS Oph in this respect is very different from Nova Cas though. My first images of Nova Cas showed it to be quite red but during a minor upsurge after the initial outburst it lost much of its colour. Recurrent novas, such as RS Oph, have a different type of light-curve where after the initial outburst they enter a period of rapid but consistent decline, often accompanied by a relative increase in light output at the red end of the spectrum as they cool. This is shown by the composite light-curve for RS Oph below, extended a few days beyond the one above.
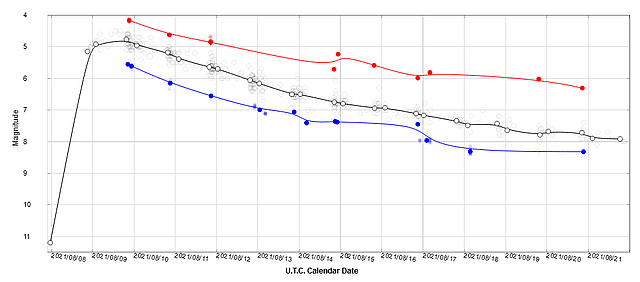
It can clearly be seen that although both the red & blue components of the light from the nova decrease as the nova fades (as one would expect), the red component does so more slowly than the blue. The nova thus gets "redder" as time goes on. The quality of my first images was insufficient to demonstrate this effect from my own observations unfortunately, but it was born out by spectra taken by BAA member David Boyd which showed the H-alpha (red end) emission line steadily increasing in intensity relative to the overall spectrum while the H-gamma (blue end) steadily declined. Click here for further details.
While narrow coloured trails enable the production of a much better visual result, they do complicate estimates of brightness. There are very few pixels to work with and it is almost certain they will not all be the same brightness as the transparency of the atmosphere (the "seeing") tends to vary literally from second to second. Although my images taken on 12th August were of a lower quality, they did at least have the advantage of being blobs rather than streaks, thus making it much easier to compare brightness without further manipulation. However, I decided not to rely on the "de-streaked" images produced by SmartDeblur, good as they are, as I could not be sure what processing had been involved in their production. I thus felt I had to fall back on the unprocessed trails.
The method I came up with was to convert the image to greyscale (to avoid issues with colour); rotate the image until the trails were vertical (so they became exact rectangles rather than sloping lines); isolate each trail of interest by placing a selection box round it; copy it & save it as a separate image, and then use the average value of all the pixels thus isolated (as given by their histogram) as the brightness - I felt that using the average would give a more consistent result than a "brightest pixel" approach, for example.
Which was fine once I had decided which were the trails of interest, of course. Comparing brightnesses on the earlier image was, fortuitously, quite easy because with the nova at magnitude 6.1 it just so happened that there were stars at 6.0 & 6.2 nearby. The later image had many stars much less bright than the nova and many which were much brighter, but very few of about the same brightness which could thus be used for an accurate comparison. The best I could find were two somewhat above it but unfortunately not only were these shown as having the same magnitude but also seemed to be of about the same brightness as the nova, rather than being "above and below". I would thus have to see what my "histogram" approach would tell me.
I thus isolated three trails - the one produced by the nova, and those of the two stars mentioned above. The trail of one of the comparison stars was rather irregular so I took two "reference strips" rather than just one, and was pleased to find that the average of the average pixel values for the two strips was very close to the value for the other comparison star of equal magnitude. I thus felt I had a good figure to compare against the nova.
My result was that the average pixel value for the comparison stars was slightly greater than that for the nova - a ratio of 1.12 in fact - which means that the nova was a little less bright than the stars. Magnitude is a logarithmic scale though, so to convert the ratio to a magnitude difference it is necessary to use the formula Difference = 2.50 x log(Ratio). Why 2.50? Because, by definition, 5 magnitudes equals a 100x difference in brightness. Log(100) equals 2 and two times 2.50 is 5, as required. The ratio of 1.12 thus corresponds to a magnitude difference of 0.123, which has to be added to the magnitude of the comparison stars to get that of the nova. The stars are mag. 6.9, so my calculation puts the nova at just a little more than 7.0
But how close is that to the accepted value? Well, the smoothed light curve gives a value of 7.1 for just before midnight on the 16th, and the average of the actual reported magnitudes for the hour before midnight is also 7.1, so it seems reasonable to take that as the standard. I thus think my result of 7.0 (and a bit!) is pretty good, given the difficulties encountered during its calculation.
A further week of cloudy nights meant that the next time I ventured out on nova patrol was on the 23rd. This was, unfortunately, the night of Full Moon, so conditions were far from optimum due to the amount of sky-glow generated. I was able to get some usable images though, which showed that the nova had dimmed considerably in the intervening week (as confirmed by the extended light-curve below).
It required a fair bit of processing to get rid of the sky-glow but I did eventually succeed:-
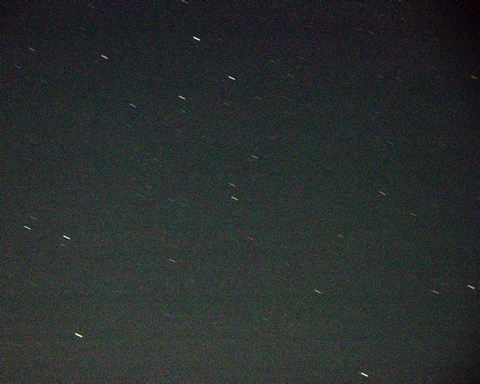 | This image shows much the same area of sky as the one for 16th August, with the nova, to lower centre, again showing its distinctive red colour. As with the previous image, one can transform the view by applying the magic of SmartDeblur - click or tap on the image to remove the trails. |
| It is not easy to see from the coloured images that the nova is dimmer on the 23rd than on the 16th, so here is a slightly zoomed-in greyscale version of the situation on the 16th, centred on the nova. Click or tap on the image to replace it with the view on the 23rd (and again to swap back & forth). Due to the amount of processing needed to derive them, the two images cannot be used to make absolute magnitude estimates but it can be seen that the nova had clearly faded in the eight days between those images. The slightly different orientation of the images is because of the time difference between them, by the way. I could have corrected for this by rotating one slightly, but that would have degraded that image a little which could have affected the brightness comparison. | 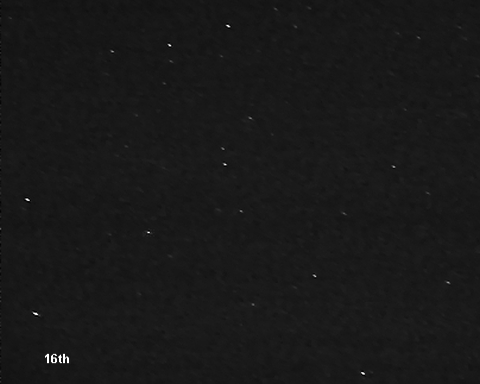 |
The moon-induced skyglow unfortunately made it impossible to accurately estimate the brightness of the nova on the 23rd - even potential comparison stars whose magnitudes are known did not give consistent outcomes - so I cannot give a calculated result for the amount by which it had faded between the 16th & 23rd. I was able to show that it had dimmed significantly though, so I felt pleased with that outcome, and indeed with my observations and findings overall.
I had expected my observations on the 23rd to be my last, as the medium-term weather forecast for the UK beyond that date was cloud, cloud & more cloud. I was thus very pleased to find that the evening of the 27th was nice and clear, so off I trekked to the allotments once more. Not only was the sky clear, but of course by then the Moon had waned somewhat and so was no longer causing a problem with skyglow - indeed, it was hiding behind the forecast cloud further round to the east. I was thus hopeful of getting some useful images, and so it turned out.
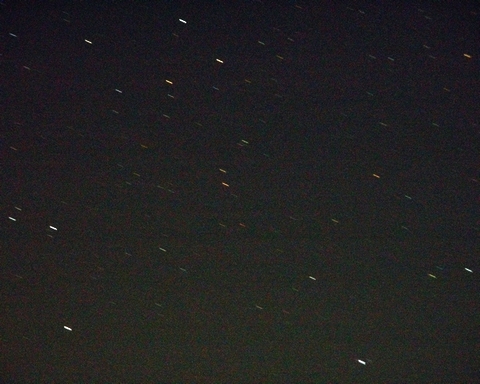 | This image again shows much the same area of sky as the earlier images, with the nova, once more to lower centre, still showing its distinctive red colour though now rather dimmer than before. As with the previous images, one can transform the view by applying the magic of SmartDeblur - click or tap on the image to remove the trails.
It is very noticeable that the good viewing conditions have enabled many more, and fainter, stars to be seen. This image is a stack of four base images, but even the individual frames show many more stars than on previous evenings. |
The major advantage of the better conditions is not so much the greater number of stars on view but an improved ability to get an accurate brightness estimate for the nova. As on the 16th though, there are few convenient comparison stars nearby and so I employed the "average histogram pixel" method relative to the star just to the left of the nova.
Given the clarity of the individual frames I felt justified in using the stack of four images, but the original, unprocessed, version rather than the slightly enhanced version displayed above. Using a stack has the advantage that an average of the four base frames has already been made by the stacking process, which smooths out any inter-frame variation and thus hopefully achieves a more accurate result. I found that the ratio between the nova and the nearby star was 1.081, with the nova slightly brighter than the star. This corresponds to a magnitude difference of 0.085, so as the star is mag. 8.4 this makes the nova 8.315
It's clearly unreasonable to quote the estimate to 3 decimal places (particularly as the comparison star is only given to 1 d.p.), but I have done so for better comparison with the official figure. Extending the AAVSO light curve, I found that the two mean values spanning midnight on the 27th were 8.238 and 8.329 - an average of 8.284 - with the three individual observations made around that time all being 8.3, which means that my estimate falls neatly within the observed range and compares well to the average value. An excellent result therefore, which seems to justify my hope that an image stack would give a more accurate value than just a single frame.
This was my last observation, as the weather during the following week again reverted to cloudy & dull and by the time we had a few clearer nights the nova had not only dimmed as far as mag. 9 but had also dropped much lower in the sky, both of which would make accurate imaging very difficult. Still, it was good to be able to capture this unusual outburst, and to derive such good information from it.
When the next bright nova will decide to pop into our skies is, of course, impossible to tell but if one does do so I hope to achieve more successes!
 Nova Cassiopeia 2021
  RS Ophiuchi 2021


