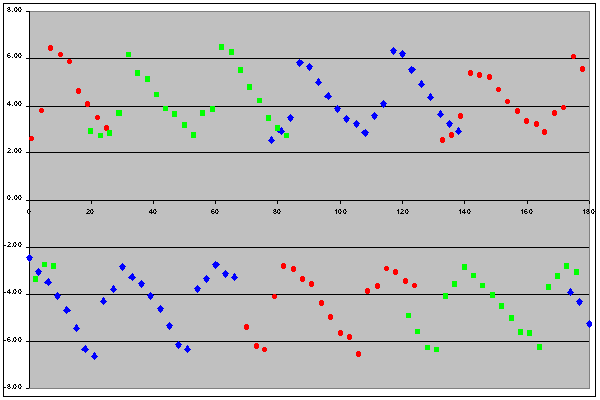
As mentioned on the main page, to determine the extremes of the annular/total changeover point I plotted the distance from perigee (in days) of the middle eclipse in every run of hybrid eclipses for every Saros series from 0 to 180. I was, of course, careful to separate the data into the usual "sets of three" to avoid the Inex effect. The result was a repeating pattern, shown below: the x-axis is the series number, the y-axis is the number of days from perigee.

The three sets of data have been shown in different colours, clearly showing that one set follows on from the next - the slight overlap is because the window along the Moon's orbit within which hybrids are possible is a little greater than the 120deg separation of the Inex triples. It is obvious that each data set is discontinuous, with gaps where the data points swap from before perigee to after, and then back again. This is due to the existence of regions where all eclipses in a series can be only total or only annular (i.e. no hybrids): the smaller discontinuity corresponds to only totals, the larger to only annulars.
I was puzzled for some time by the very distinctive shape of the graphs. [Note that the lower segments are actually the same shape as the upper, only inverted]. I knew that the changing distance of the Sun from the Earth must have some effect on the changeover point (as it affects the apparent size of the Sun) but only when I plotted it out did I realise that this variation in fact provides the entire explanation for the shape of the graphs. Click/tap on the diagram to replace it with just one graph segment, overlaid in light-blue with a representation of the number of days the corresponding eclipses are away from perihelion (adjusted for precession and scaled to fit on the same y-axis). It is clear that the correspondence is almost perfect. It is also consistent with the geometry of the situation, in that the changeover points nearest to lunar perigee (when the Moon is large) correspond to occasions when the Earth is close to perihelion (when the Sun is also large) and those far from perigee (when the Moon is smaller) correspond to the Earth being close to aphelion (when the Sun is at its smallest).
By calculating a mean value for the high and low points of the graphs in the diagram, we see that the "average largest" and "average smallest" distances from perigee when a hybrid eclipse is still just possible are 6.47 days and 2.63 days respectively. Given that there are 13.775 days from perigee to apogee, the corresponding distances from the "hybrid point" to apogee would thus be 7.305 and 11.145 days.